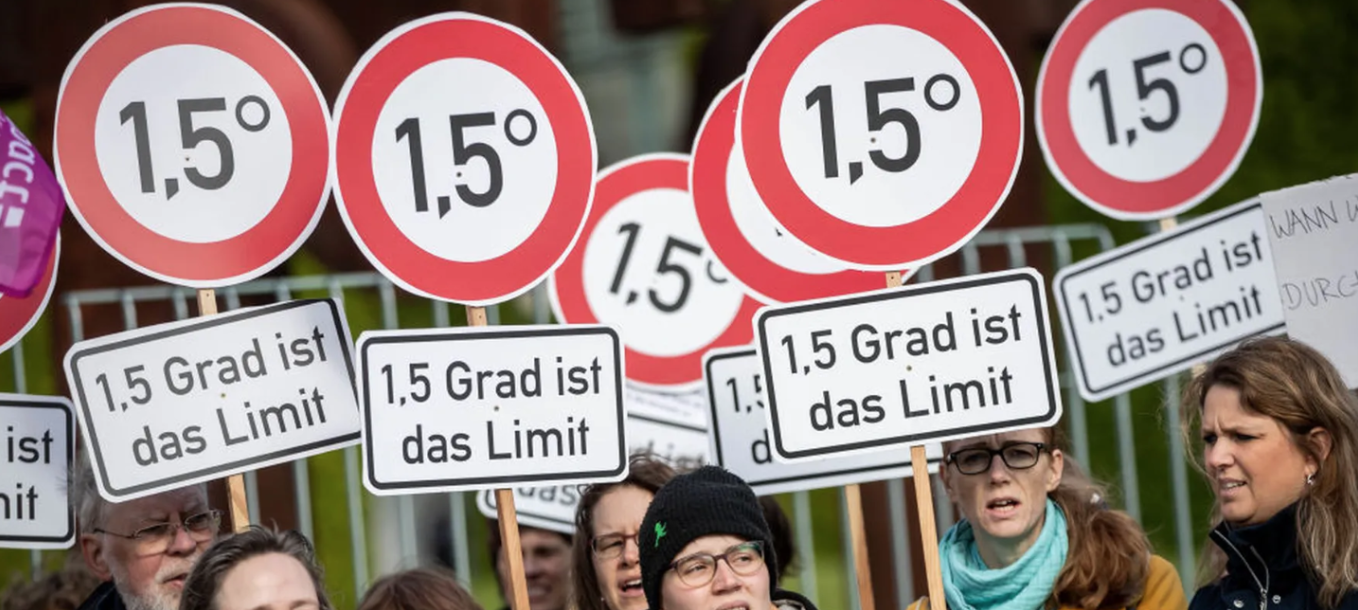
The problem – abatement prioritization
Companies, just like countries, want to reduce their carbon emissions footprint and reach net zero. They are, however, facing similar challenges as countries. For instance, a country may have 5 sectors in its economy, accounting for 80% of its carbon emissions. Each sector emits carbon and has various options to reduce its emissions, all at different costs. Depending on the objective and the planning horizon, there are many combinations of measures, each with different costs, timing, and abatement results.
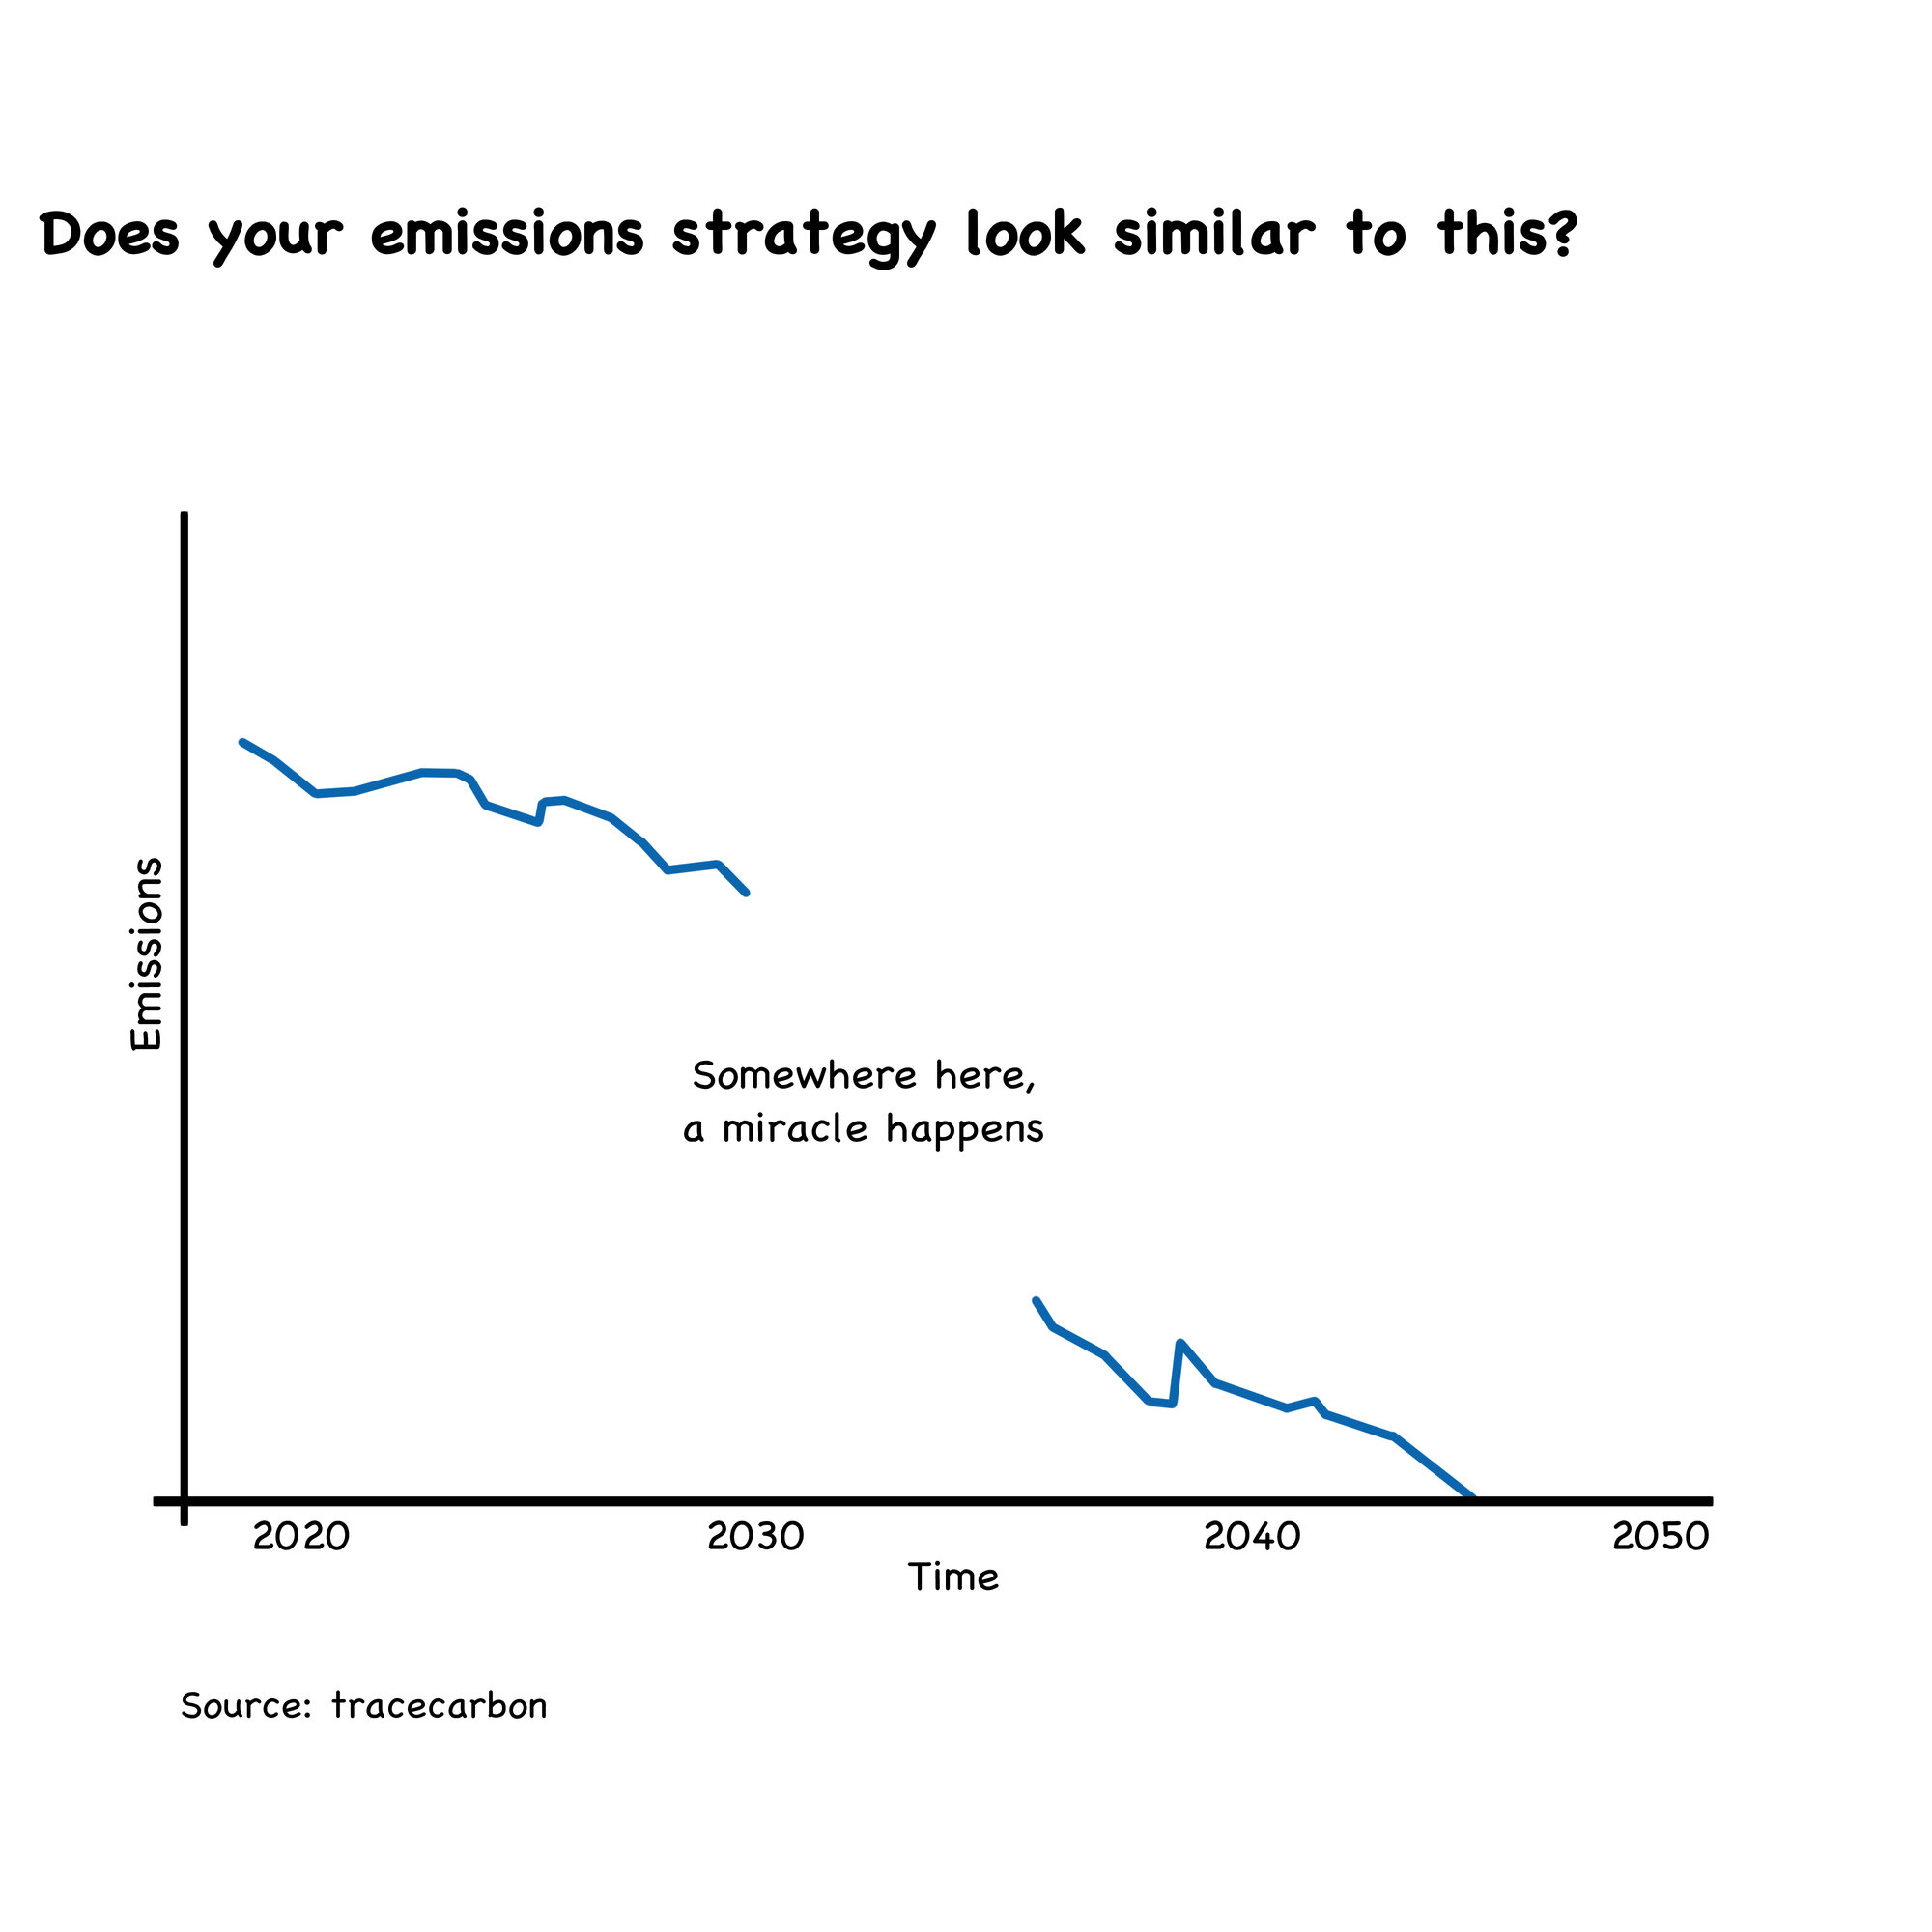
The same problem is what many companies are facing – although on a smaller scale. There are many identified measures that will “somehow deposit on your carbon footprint roadmap”. But they certainly do not construe a structured plan and are definitely not based on a consistent “prioritization logic” to group measures over time and by impact to reduce emissions to net zero until 2050 (or before). “True and fair” roadmaps in real life would often look somewhat like this:
Cost curves can help to solve the abatement prioritization problem
This is where cost curves can be useful. A cost curve is in general just a microeconomic graph that shows how much output suppliers can produce at a given cost per unit (and often associated with McKinsey&Company, the consultancy, where Don Watters made the concept popular since the 1980s). In our context, a cost curve – more precisely, a marginal abatement cost curve, or MACC – is a tool to understand what costs are associated with abatement measures, thus indicating where a carbon reduction journey could start. In comparison to cost curves, MACCs substitute cost per input (e.g. per kwh) with cost per CO2-e abatements (e.g. in € per ton of Co2-e). The MACC represents the costs (or savings) expected from different carbon reduction initiatives, combined with the volume of emissions that could be reduced if implemented.
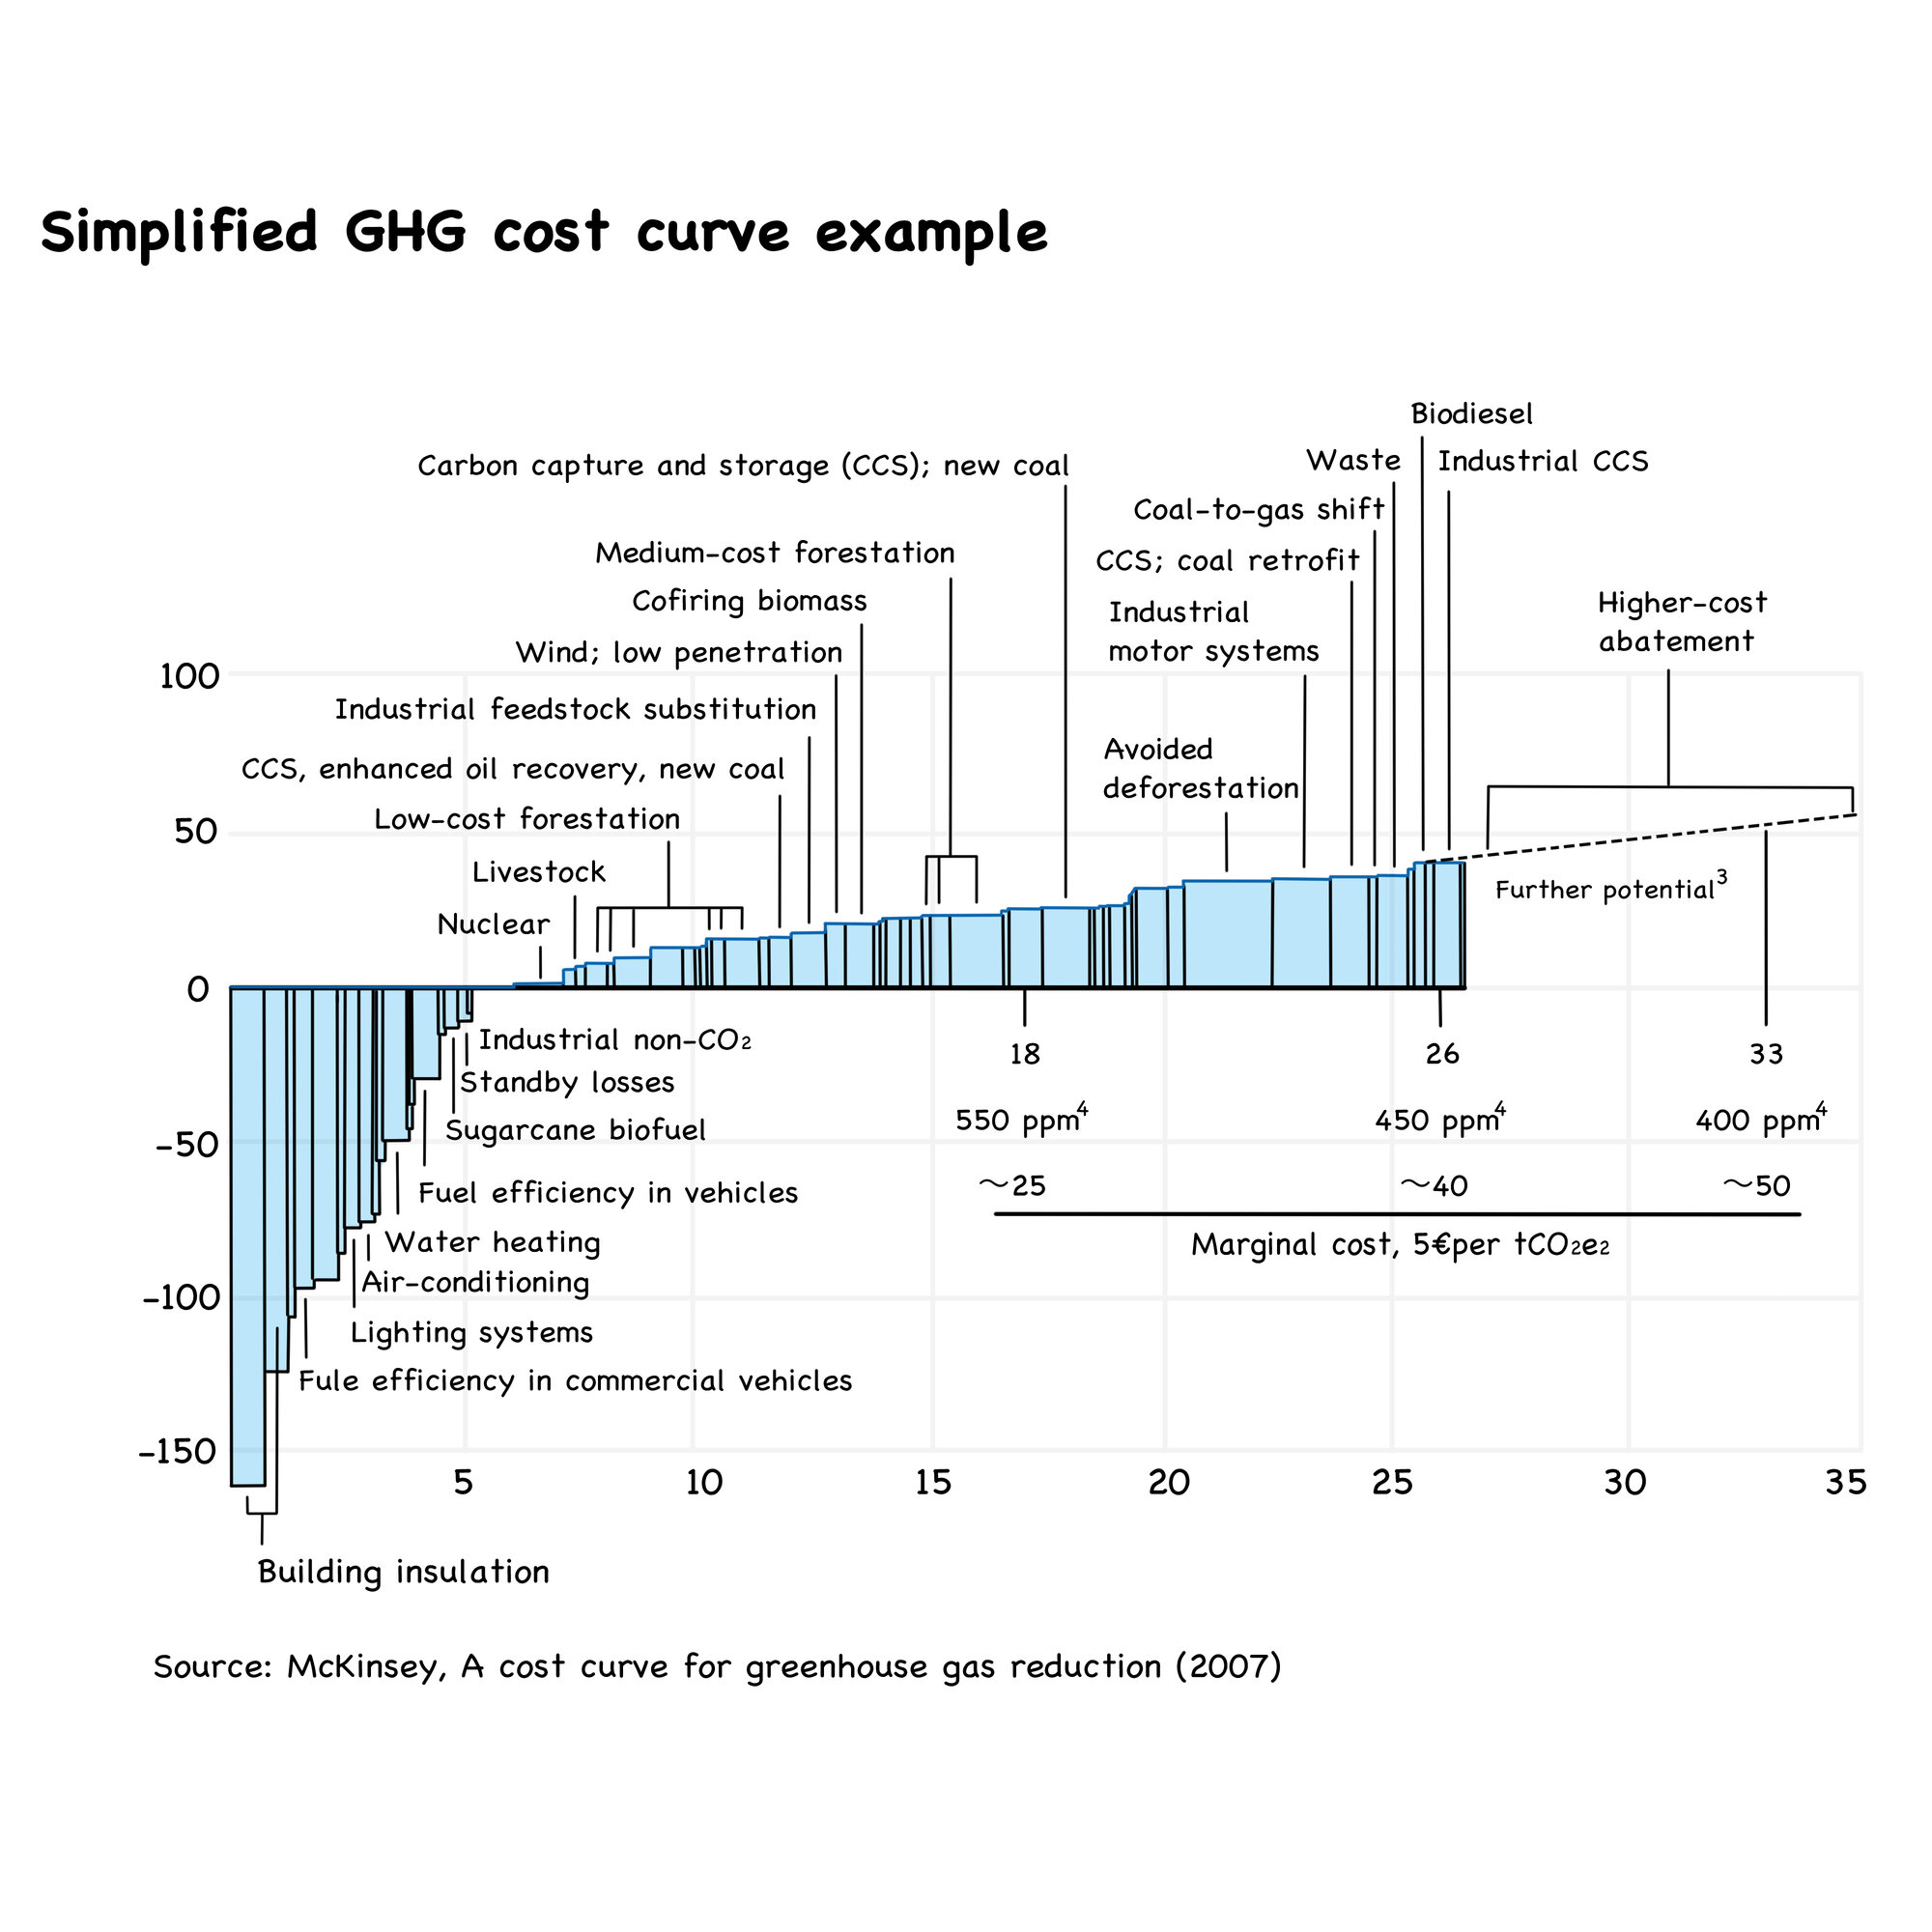
MACCs measure and compare the financial cost and abatement benefit of individual actions and generally optimize for the least cost per unit. They typically use the metric of currency per tonne of carbon dioxide equivalent – represented as cost (in €) per ton of CO2e. And although they are typically used on a country/industry level, they can be a powerful tool to show measures for companies on a straight line in a relatively simple “bang for the buck” logic.
Why this is helpful? Because many companies identify a lot of possible measures to reduce their carbon footprint. Typically a lot more than are feasible at any point in time. To structure and prioritize measures, we group them by impact on footprint and cost per CO2-e abatements. Each measure – such as implementing renewable energy, improving building efficiency, and carbon forestry is shown as a box above or below the x-axis of the coordinate system.
Measures/boxes above the x-axis indicate there is a cost to that action – the higher the box, the higher the cost. Measures/boxes below the x-axis indicate savings from that measure – the lower the box, the greater the saving. So we can compare the cost and impact of measures for a pre-defined time horizon.
The width of measures/boxes indicates the measures’ potential for emissions reduction, expressed as tCO2e. The curve shape is created by ordering the actions from the lowest cost to the left, to the highest cost on the right.
Why cost curves are not perfect
An efficient allocation of resources is crucial for emissions reduction. However, there are more than a few challenges for cost curves:
First, the emission reductions related to different measures must be normalized. Typically, we calculate carbon dioxide equivalents, hence including effects from other GHG such as methane.
Furthermore, timing/planning horizons are crucial. We need to include long-term costs (capex/investments as well as operating costs) as well as emissions reductions – the exact timeline depends, but should extend at least until 2050, the year when humanity has agreed to reach net zero GHG emissions. Longer equals better, in our opinion. And of course, calculations on an annual basis make little to no sense, considering the form of reduction curves over time, uncertainty, and inter-temporal dynamics.
A rigid usage of MACC in situations where some included measures have negative costs can also lead to counterintuitive (aka “wrong”) conclusions from an abatement perspective, as Fabian Levihn has pointed out. Which is more of a theoretical problem, in our opinion.
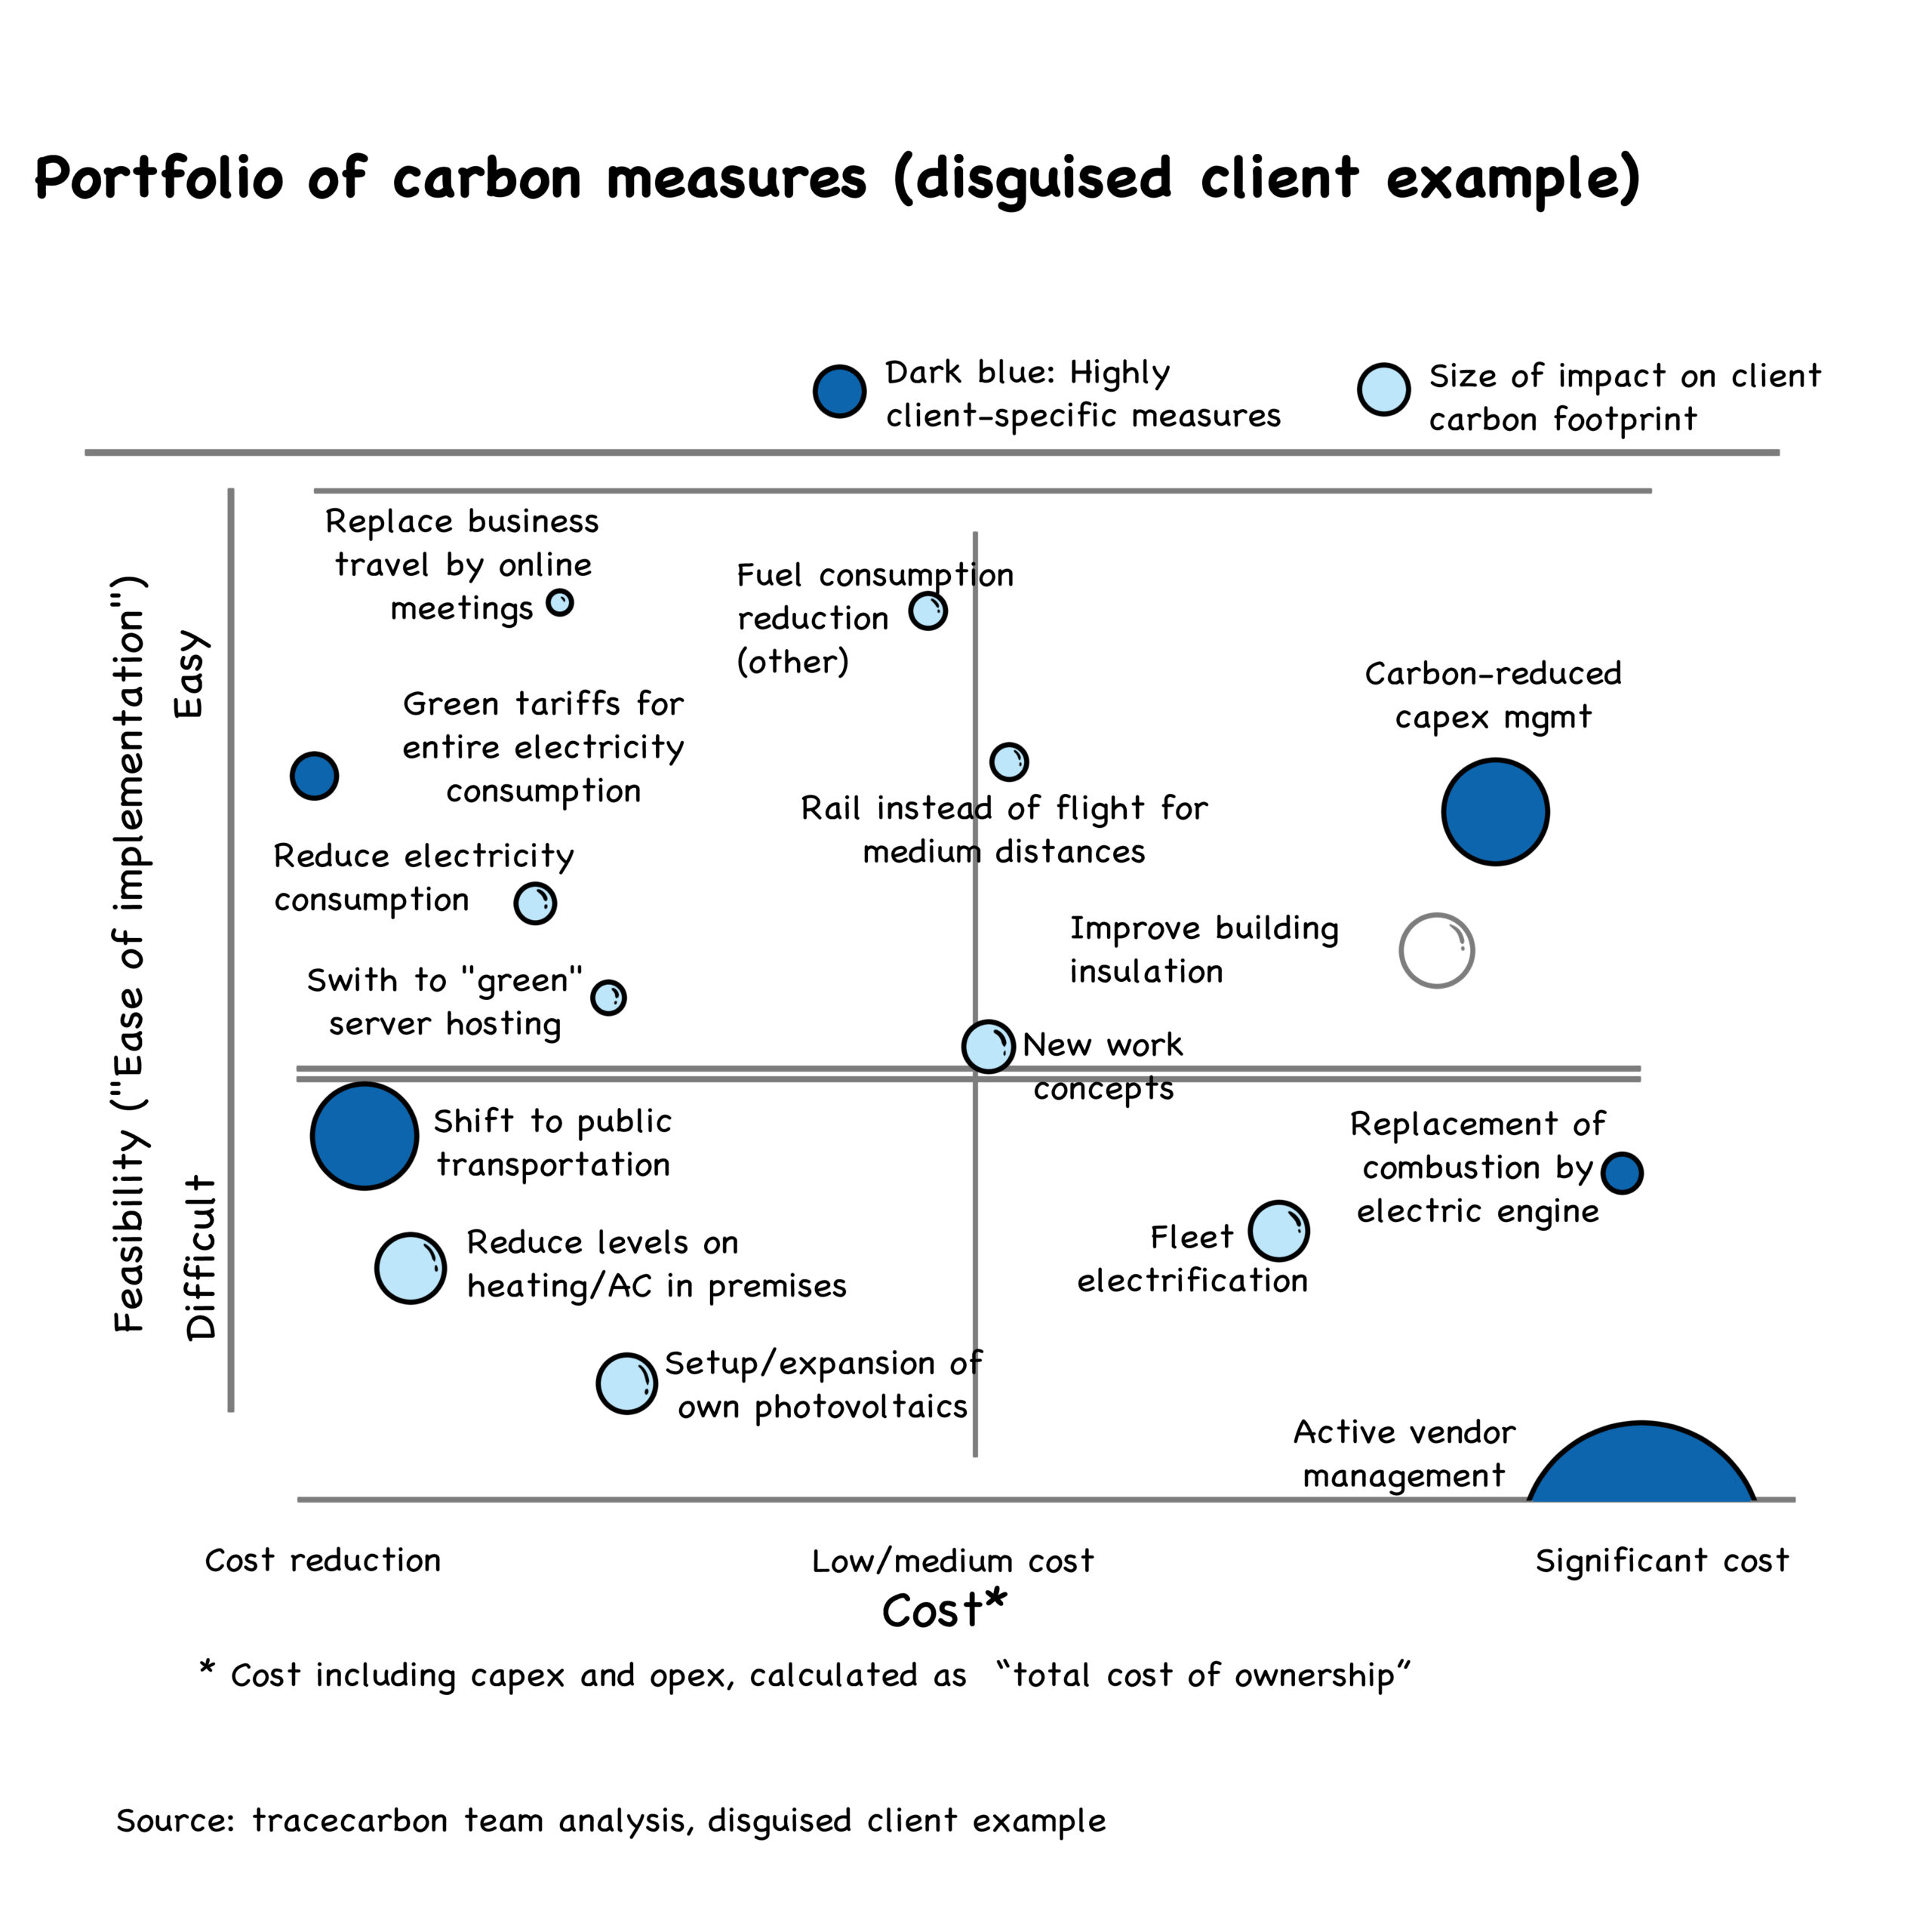
Most practical problems arise from different timing horizons (as mentioned above). Traditional MACC can lead to under-investment in expensive, long-to-implement, and large-potential measures while leading to over-investment in cheap but limited-potential measures. These and other arguments against marginal abatement cost curves, including their lack of transparency, problems when costs could take negative values, and the treatment they make of uncertainty, and inter-temporal dynamics, have real merit. However, other models and prioritization tools we are using like this simple matrix are – in our humble opinion – not necessarily better, as we would like to underline with the following “prioritization matrix” (an alternative to MACC that we have used on occasion):
Typical results on how to reduce your carbon footprint
Interpretation of company cost curves can be non-trivial, especially as a planning enterprise must consider longer-term (timing) horizons. However, complexity aside, for all of our clients, there have been at least a few “no regret moves” to reduce your carbon emissions that will make sense in any planning scenario – and some of these go well beyond the obvious, like switching your electricity tariffs to green energy only (note: you should do that too. But you will not need us or a consultancy for that).
An analysis conducted by the tracecarbons expert team indicates the following “typical” examples for improvement levers – obviously, depending on company, industry, size, location, and many other factors:
- Scope 1 – consumption focus
- Heating consumption: Reduction of heating consumption (reduced office temperature, better ventilators). For example, the reduction of office temperatures in the evenings and weekends (“cool-at-nite-time”) is a quick win with significant improvement potential. The improvement of building isolation is a longer-term improvement, such as the implementation of elements of bioclimatic architecture
- Fleet management (1): Reduction of not-needed (combustion) cars by changing company policies and compensation packages, as well as the reduction of mileage thru the usage of public transportation, fall into the “consumption” side of fleet management
- Cooling consumption: Appropriate maintenance of your cooling equipment will avoid excessive refrigerant losses. Select the proper equipment for the proper use. Don’t oversize the equipment you need. And please, select an energy efficient one (+A label). Also, the heating and cooling phases should be in sync. Pls ensure that heating and cooling systems are not competing (heating and cooling setpoints should not overlap, and air should not be heated, then cooled back down again)
- Scope 1 – improvement of emissions factors
- Heating and cooling factors: Replacement of oil/gas heatings with climate-neutral heaters (heat pumps, solar). Longer-term measures can include the usage of heat pumps and if you are able to, geothermal heat pumps. Solar collectors are a great renewable source of heating. You can implement it as a hybrid system, complementing your current heating installation. If you are using the industrial process in your company and it is using heating flows, surely you can optimize its use
- Fleet management (2): Replacement of (combustion) cars with electric vehicles or other (“greener”) means of transportation fall in this bucket
- Scope 2 – consumption focus
- Electricity savings in lighting, computers, etc: This list could be endless. From turning off all electricity consumers when not needed (not standby) to turning off the lights in the office earlier and faster, there are zillions of quick wins. Few of them are already used fully, in our experience
- Longer-term measures include an energy efficiency assessment of your industrial equipment. You can reduce energy consumption by choosing the most appropriate equipment (engines, pumps, compressors) and using them at the highest efficiency point. This will require some capex /investment (see Scope 3 for that)
- Scope 2 – improvement of emissions factors
- Switch to green electricity tariffs (kudos to Professor Obvious for pointing this one out; we would have never thought of that)
- Use a “green” hosting provider instead of your own servers: Green hosting providers use data centers with significantly higher energy efficiency than most “own” on-site servers (see also Scope 3)
- Setup or expansion of own photovoltaics
- Use low-consumption equipment (+A label)
- Scope 3 – consumption focus
- Manage material spend, capex as well as leased assets by consuming fewer and less emissions-intensive (capital) goods. Extend usage time and recycle/reuse where possible
- Avoid business trips that are not absolutely necessary. And if you have to do it, please select the less polluting transportation (no need to take a flight for a 500 km trip)
- Commute less by evaluating a work-from-home/in-office scenario to optimize energy use and reduce travel
- Reduce waste across the value chain
- Scope 3 – improvement of emissions factors
- Prioritize suppliers considering if they work with sustainability certification, if they are committed to carbon management and reduction, and if they are tracking their own carbon emissions
- Reduce emissions in downstream transportation by using “greener” delivery and distribution partners
- Opt for climate-neutral solution for commuting of employees (public transport, ebikes); free ebike-offers (tax-subsidized in Germany) and car-sharing offers with e-vehicle
- Prioritize the purchase of materials that use less packaging or the one they use is recyclable
- Reuse and recycle the maximum possible amount of waste
- The “Scope 3 equivalents” of the items in Scope 1 and 2 (e.g “green servers”)
Conclusion
Prioritizing measures on the decarbonization roadmap can be very difficult. The marginal abatement cost curve (MACC) is one of our abatement prioritization tools. It has many merits if applied on a company-level, and a few pitfalls. MACC can lead to under-investment in expensive, long-to-implement and large-potential measures while leading to over-investment in cheap but limited-potential measures; they oversimplify and lack transparency, can cause problems when costs could take negative values, and their treatment of uncertainty, and inter-temporal dynamics, are not great. However, other models and prioritization tools we are using have their problems too, so that in our opinion, MACC is avaluable tool to structure and illustrate our thinking about priorities and sequence of carbon abatements.
Please read on @here about our thinking about the “tradeoffs” (terrible word, considering the context) between abatement and offsetting, especially using MACC.